Introduction
Because 3D structure is
actually much more conserved than sequence, 3D structure comparisons
allow us to look even further back into biological prehistory. The
most common method for 3D structure comparison is called structure
superposition. Superposition (or superimposition) is simply the
process of rotating or orienting an object until it can be directly
overlaid on top of a similar object. The SuperPose web server uses a
combination of sequence alignment, difference distance matrix
comparison and quaternion eigenvalue superposition to allow users to
superimpose 3D structures in 5 different ways:
1) Two molecules of identical sequence and structure (i.e. chains of 2TRX). See example
2) Two
molecules of identical sequence but profoundly different structure
(i.e. open and closed forms of calmodulin). See example
3) Two molecules of modestly dissimilar sequence, length and
structure (i.e. hemoglobin A and B chains). See example
4) Two molecules that are profoundly different in sequence but similar in
structure (i.e. ubiquitin and elongin). See example
5) Two
or more molecules of identical sequence but slightly different
structure (i.e. crystal subunit isoforms, NMR structure ensembles). See example
SuperPose Input
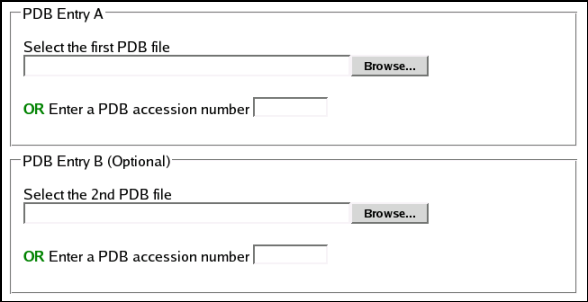
SuperPose requires one
or more properly formatted PDB file which can be retrieved from the
Protein Data Bank at www.rcsb.org
or which can be generated using most kinds of molecular modeling
software (CNS, Xplor, CCP4, DeepView, Gromacs, Babel, MOLMOL) or homology modeling
software (DeepModel or other structure prediction web servers). These
files may be edited by the user to remove chains, polypeptide
segments, atoms or comments that are not needed. The most common
reason for SuperPose to not work is that the input PDB file has been
corrupted or improperly prepared. SuperPose allows PDB files to be
uploaded either as:
1)
PDB files (txt format) from the user’s hard drive
or
2) PDB accession
numbers
If a user chooses to
use PDB accession numbers, the program automatically goes to the
PDB website and retrieves the necessary files. This is the safest
way of getting a properly formatted PDB file. SuperPose also allows
users to interactively select chains within PDB files if they are not
familiar with the chain structure or chain content in their chosen
PDB file. This is done simply by clicking on the name of the chain
in the scroll boxes that SuperPose generates after it has read each
PDB file. Models and chains can also be selected directly from the main
input page by following the pdb accession with an underscore (or colon)
and the model/chain identifier as illustated in the following examples:
- 1BQV
- 1BQV is an NMR ensemble containing 28 models. Each model contains a single chain. To select the chain in model 5, enter: 1BQV_5 or 1BQV:5
- 1HBB
- 1HBB contains a single model with four chains (A,B,C, and D). To select chain B, enter: 1HBB_B, or 1HBB:B
- 1A03
- 1A03 is an NMR ensemble containing 20 models. Each model contains 2 chains (A and B). To select chain A from model 12, enter: 1A03_12_A or 1A03:12:A
Inputting Multiple Models
SuperPose accepts as input only 2 PDB files, but each PDB file may contain mutliple models and/or chains. If you wish to superimpose structures contained in more than 2 PDB files you will have to concatenate them into at most 2 files. A handy way to do this is to use SuperPose initially to superimpose the structures from 2 PDB files. SuperPose provides a PDB file of the superimposed structures for you as part of its output. The superimposed structures can be used as input with another file, and this process repeated until all the desired files are concatenated and superimposed. Alternately, you can manually concatenate the structures into a single PDB file using a text editor, or more preferably with molecular modeling software.
Options
Output Options
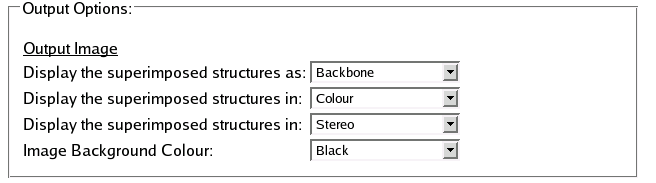
SuperPose features a number of options for customizing the still image output, including:
- Style:
- Choose from Backbone or Ribbon styles.

- Colour:
- Choose from Greyscale or Colour.

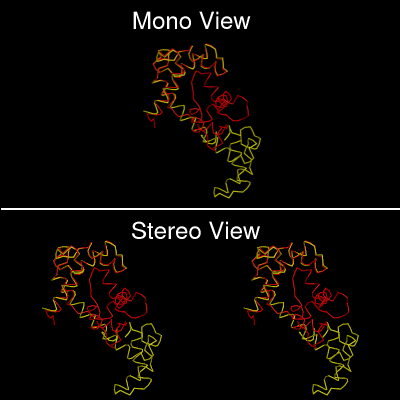
- View:
- Choose from Mono or Stereo View.
- Background:
- Choose from Black or White.

Alignment Options

In order to perform a superposition, SuperPose needs information on which pairs of atoms to 'match' for the superposition (see How SuperPose Works). You may specify the alignment by entering residue numbers (PDB numbering) directly in the Alignment Options box. Specify comma-separated ranges of residues in ascending order (eg. 5-14, 35-100, 115-140). Ensure the total number of residues in each textbox are equal (if superposing structures from 2 different PDB entries). For automated alignments, simply leave these boxes blank.
- Example: Global Alignment
- Say you want to use the following alignment for superposition:
PDB_Entry_A      1 SDKIIHLTDDSFDTDVLKA--DGAILVDFWAEWCGPCKMIAPILDEIADE     48
                     .:..:...:...:.|.|  |..::|||.|.||||||||.|....::::
PDB_Entry_B      1   MVKQIESKTAFQEALDAAGDKLVVVDFSATWCGPCKMIKPFFHSLSEK     48

PDB_Entry_A     49 YQGKLTVAKLNIDQNPGTAPKYGIRGIPTLLLFKNGEVAATKVGALSKGQ     98
                   |...:.: ::::|.....|.:..::..||...||.|:    |||..| |.
PDB_Entry_B     49 YSNVIFL-EVDVDDCQDVASECEVKCTPTFQFFKKGQ----KVGEFS-GA     92

PDB_Entry_A     99 LKEFLDANLA       108
                   .||.|:|.:.
PDB_Entry_B     93 NKEKLEATINELV    105
Identify the residues that are aligned to a gap, and therefore unmatched. Exclude these residues from the list of residue numbers for the alignment. For PDB Entry 'A', residues 1-2 (SD), 56 (A), 86-89 (VAAT), and 96 (K) align to gaps. Enter the residue ranges for PDB entry 'A' as follows:
PDB_Entry_A: 3-55, 57-85, 90-95, 97-108
For PDB Entry 'B', residues 18-19 (AG), and 103-105 (ELV) align to gaps. Enter the residue ranges for PDB entry 'B' as follows:
PDB_Entry_B: 1-17, 20-102
- Example: Local Alignment
- Say you wish to superpose an NMR ensemble of structures contained within a single PDB Entry, and you wish to restrict the superposition to the N-terminal 50 residues. Enter the residue list as follows:
PDB_Entry_A: 1-50
Advanced Options
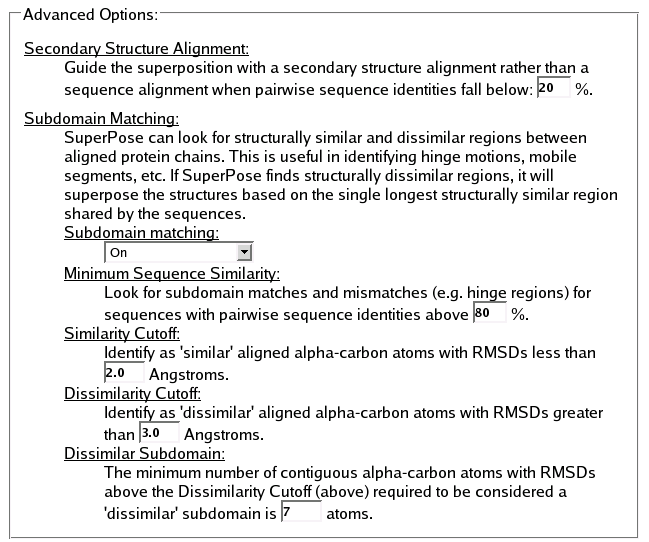
The advanced options allow you to adjust certain parameters that SuperPose uses to decide how to best superimpose two or more structures. Don't tinker with these options unless you understand How SuperPose Works!
- Secondary Structure
-
For structures sharing remote homologies, sequence alignments can be poor, whereas the structural similiarity may very well be preserved. For alignments with low sequence identity, SuperPose will attempt a secondary structural alignment, and use this information to guide the superposition. The Secondary Structure Alignment option allows you to determine the percent-identity cutoff for sequence-vs-secondary-structure alignments.
- Subdomain Matching
- SuperPose can look for structurally similar and dissimilar regions between aligned protein chains. This is useful in identifying hinge motions, mobile segments, open and closed forms of protein structures, etc. If SuperPose finds structurally dissimilar regions, it will superpose the structures based on the single longest structurally similar region shared by the two structures.
- Subdomain Matching
-
This option toggles the subdomain matching algorithm on or off. This is handy if you wish to ignore the structural differences in your set of structures, and instead superpose them based on a global sequence alignment.
-
Minimum Sequence Similarity
-
SuperPose assumes that you want to perform subdomain matching primarily for superposing the structurally similar domains of highly related structures, therefore SuperPose uses a high default minimum pairwise sequence identity cutoff of 80 percent. Only alignments greater than this value are considered for subdomain superpositions.
-
Similarity Cutoff
-
When performing a subdomain match, SuperPose identifies the longest 'similar' stretch of residue pairs, and uses this subdomain for the superposition. This option allows you to adjust the degree of similarity by setting the maximum allowable RMSD contained in a stretch of residues pairs.
-
Dissimilarity Cutoff
-
Superpose identifies candidates for subdomain superposition by checking the difference distance matrix for stretches of residue-pairs with an RMSD greater than the dissimilarity cutoff. Stretchs of residue-pairs with an RMSD value above this cutoff and exceeding a certain number of residues will trigger a subdomain superposition.
-
Dissimilar Subdomain
-
Superpose identifies candidates for subdomain superposition by checking the difference distance matrix for stretches of residue-pairs with an RMSD greater than the dissimilarity cutoff (above) and exceeding the Dissimilar Subdomain length (number of alpha carbon pairs).
SuperPose Output

SuperPose produces up
to seven kinds of output:
1) a PDB file
containing the coordinates of the superimposed molecules;
2) a PDB file
containing the backbone coordinates of a single averaged structure
(if all sequences match identically);
For output #1 and #2,
the file is in a txt format and it can be used directly in other
kinds of modeling or viewing software. The output in #3 is also in
txt format and it may be used simply to track which residues have
been matched in which chains.
3) a sequence and/or secondary structural alignment
(pairwise or multiple) file of the sequences used in the alignment;

4) a difference
distance matrix (if only 2 molecules are superimposed);

The difference distance
matrix (output #4) is generated as a PNG image that may be used to
visually identify regions where there are significant differences
between any two structures. The lighter the region, the more similar
the structures are. Likewise the darker the region, the more
different the structures are. The default display for SuperPose’s
difference distance plot shows 6 graded cutoffs. Differences between
0 and 1.5 Angstroms are white, differences between 1.5 and 3.0 A are
yellow, differences between 3.0 and 5.0 A are a light green,
differences between 5 and 7 A are colored dark turquoise, differences
between 7 and 9 are colored dark blue and those greater than 9 are
colored black. To learn more about difference distance plots please
read the following paper: Richards, F.M. and Kundrot, C.E. (1988)
Identification of structural motifs from protein coordinate data:
secondary structure and first-level supersecondary structure.
Proteins. 3, 71-84.
5) the calculated RMSD
values (in Angstroms) between the superimposed molecules;

6) a still image (PNG)
of the superimposed molecules generated using MolScript

7) a WebMol applet view
of the superimposed molecules.

The WebMol viewer is a
Java applet for simple structure viewing. It may not work if a
user’s site is protected by a firewall or if a user’s
browser doesn’t have the Java run time library installed
(especially recent versions of Internet Explorer).
How SuperPose Works
SuperPose uses a combination of sequence (or secondary structure) alignment, difference distance matrix analysis, and quaternion superposition to superpose two or more protein chains. The procedure for multiple-chain (3 or more) superposition differs somewhat from simple 2-chain superposition, so these procedures are described separately.
|
- 2-Chain Superposition
-
- Alignment
-
SuperPose extracts the protein amino acid sequence from the atomic coordinate data
for each chain, and then aligns the two sequences using a needleman-wunsch global
alignment (BLOSUM62). The sequence identity is examined to determine the relatedness
of the two chains. If the identity is low (default <25 %), SuperPose extracts
the secondary
structure information for the two chains and performs a secondary structure alignment.
If the sequence identity is high (>80%), will look for structural dissimilarity
(hinge regions, open / closed forms, etc.) by analysis of the difference distance
matrix. Alignments with identities falling between these two ranges are superposed
using all the matched C-alpha carbons in both structures.
- Difference Distance Matrix
-
A difference distance (DD) matrix can be generated by first calculating the distances
between all pairs of C-alpha atoms in one molecule to generate an initial distance
matrix.
A second pair-wise distance matrix is generated for the second molecule and, for
equivalent/aligned C-alpha atoms, the two matrices are subtracted from one another,
yielding the DD matrix. From the DD matrix it is possible to quantitatively
assess the structural similarity/dissimilarity between two structures. In fact,
the difference distance method is particularly good at detecting domain or hinge
motions in proteins. For sequences with high identity (default >80%), SuperPose
analyzes
the DD matrix to look for dissimilar regions, defined by a stretch of 7-or-more
aligned C-alpha pairs with RMSD over a certain cutoff (default 3 Angstroms).
If a significant dissimilarity is found, SuperPose will
perform a 'subdomain superposition'. This is accomplished by finding from the
DD matrix the longest
stretch of C-alpha pairs with RMSDs below a certain cutoff (default 2 Angstroms).
SuperPose restricts the superposition to the C-alpha carbons contained in this
stretch.
- Quaternion Superposition
-
Once Superpose has identified the optimal matching of pairs of C-alpha atoms
between the two
protein structures, it can proceed with the quaternion Superposition, as described by
Kearsley [1]. Superposition is achieved by rotating one chain around its geometric
center to orient it with the other structure, then translating the structure so that
they have a common geometric center.
- Multiple Chain Superposition
-
- Pileup
-
Multiple chain superpositions follow in general the procedure described for two chain
superpositions, but with some important differences. For multiple superpositions,
SuperPose extracts the sequence
information for all the structures, and performs an all-against-all alignment and DD
matrix analysis. An average RMSD value is determined for the alpha-carbons of each
aligned pair by examination of the DD matrix. The alignments are then sorted
by average RMSD, from lowest to highest. A pileup is performed as follows: the aligned
pair with the lowest RMSD is selected to start the pileup. The other alignments that
contain one structure that is represented in the pileup and one structure that not
not represented in the pileup are examined for their RMSD values. From this set,
the alignment
containing the lowest RMSD is identified and added to
the pileup. This process is iterated until all structures are represented in the
pileup. The pileup determines the order of superposition for the multiple structures.
At this stage, SuperPose examines the DD matrix for each pair to detect structural
dissimilarity (described above). If found, SuperPose will perform a subdomain
superposition for all the structures in the collection. If all the structures are
sufficiently similar, SuperPose will perform a global superposition.
- Superposition
-
Before superposition, SuperPose examines the sequences in the pileup and determines if
they all have the same sequence or if the pileup contains a collection of different
sequences. If all the sequences are the same, SuperPose uses a 'superpose to average'
strategy, otherwise SuperPose uses a 'pairwise superposition' strategy.
- Superpose to Average
-
For collections of structures with a common sequence SuperPose proceeds as follows:
SuperPose
superimposes the first two
structures from the pileup, creates an average structure, and then superposes the
subsequent structure with the average structure. A new average structure is created
from the collection of superposed structures, and the process is repeated until all
structures have been superposed. RMSD values for the collection are calculated
from mean (i.e. a mean structure is calculated from the ensemble and the RMSD
determined from each structure to the mean. The reported RMSD is the mean of
these RMSDs).
- Multiple Pairwise Superposition
-
If the collection of structures to be superposed contain
dissimilar sequences, SuperPose superimposes the first two structures and adds them to a
collection of 'superposed structures'. The next structure is
superposed to the most similar structure from the collection of superposed structures,
and the process repeated until all the structures are superposed. RMSD values for
the collection are calculated pairwise (i.e the RMSDs are calculated for each pairwise superposition, and the mean RMSD from these values are reported.)
[1] S.K.Kearsley, On the orthogonal transformation used for structural comparisons, Acta Cryst. A45, 208 (1989)
How SuperPose Measures Up
This table presents a comparison of RMSD values between SuperPose, DeepView, and MolMol, using matching alignments.
|
Structure(s),
Sequence ID & Category
|
SuperPose
Backbone RMSD (Å) & match residues
|
DeepView
Backbone
RMSD (Å) & match residues
|
MolMol
Backbone
RMSD (Å) & match residues
|
|
Same
Sequence + Similar Structure (pair)
|
|
|
|
|
Thioredoxin (2TRX_A vs. 2TRX_B) 100% ID
|
0.77 (1-108)
|
0.77 (1-108)
|
0.66 (1-108)
|
|
Hemoglobin (4HHB_A vs. 1DKE_A) 100% ID
|
0.37 (1-141)
|
0.37 (1-141)
|
0.36 (1 -141)
|
|
P21 Oncogene(6Q21_A
vs. 6Q21_B) 100% ID
|
1.27 (1-171)
|
1.27 (1-171)
|
1.16 (1-171)
|
|
~Same
Sequence + Different Structure (pair)
|
|
|
|
|
Calmodulin
(1A29 vs. 1CLL) 98.6% ID
|
14.97 (4 -146)
|
15.02 (4-146)
|
14.94 (4-146)
|
|
Maltose Bind Prot. (1OMP vs. 1ANF) 100% ID
|
3.76 (1 -370)
|
3.76 (1-370)
|
3.76 (1-370)
|
|
Similar
Structure + Different Length (pair)
|
|
|
|
|
Hemoglobin (4HHB_A vs. 4HHB_B) 43% ID
|
1.21
4HHB_A (51-141)
4HHB_B (56-146)
|
1.21
4HHB_A (51-141)
4HHB_B (56-146)
|
1.16
4HHB_A (51-141)
4HHB_B (56-146)
|
|
Thioredoxin (3TRX vs. 2TRX_A) 29% ID
|
1.70
3TRX (23-49)
2TRX_A (23-49)
|
1.70
3TRX (23-49)
2TRX_A (23-49)
|
1.63
3TRX (23-49)
2TRX_A (23-49)
|
|
Lysozyme/Lactalbumin(1DPX vs.1A4V)
36% ID
|
2.05
1DPX (32-99)
1A4V (29-96)
|
2.05
1DPX (32-99)
1A4V (29-96)
|
1.91
1DPX (32-99)
1A4V (29-96)
|
|
Calmodulin/TnC (1CLL vs. 5TNC) 47% ID
|
5.24
1CLL (4-78)
5TNC (14-88)
|
5.24
1CLL (4-78)
5TNC (14-88)
|
5.21
1CLL (4-78)
5TNC (14-88)
|
|
Similar
Structure + Very Different Sequence
|
|
|
|
|
Ubiquitin/Elongin (1UBI vs. 1VCB_A) 26% ID
|
2.19
1UBI (12-66)
1VCB_A(13-67)
|
2.19
1UBI (12-66)
1VCB_A(13-67)
|
2.11
1UBI (12-66)
1VCB_A(13-67)
|
|
Thio/Glutaredoxin(3TRX
vs. 3GRX_A) 7% ID
|
1.75
3TRX (78-89)
3GRX_A(54-65)
|
1.76
3TRX (78-89)
3GRX_A(54-65)
|
1.51
3TRX (78-89)
3GRX_A(54-65)
|
|
Hemoglobins (1ASH vs. 2LHB) 17% ID
|
1.90
1ASH (26-54)
2LHB (34-62)
|
1.90
1ASH (26-54)
2LHB (34-62)
|
1.76
1ASH (26-54)
2LHB (34-62)
|
|
Thioredoxins (1NHO_A vs. 1DE2_A)
22% ID
|
4.04
1NHO_A(13-30)
1DE2_A(14-31)
|
4.04
1NHO_A(13-30)
1DE2_A(14-31)
|
3.85
1NHO_A(13-30)
1DE2_A(14-31)
|
|
Multiple Structures + Same Sequence
|
|
|
|
|
Pointed Domain
(1BQV, 28 chains) 100% ID
|
6.28 (all
atoms) Subdomain match off
7.87 ( all
atoms)
Subdomain match on
|
Failed
|
5.88 (all
atoms)
|
|
Trypsin Inhibitor
(1PIT, 20 chains) 100% ID
|
1.32 (all
atoms)
|
Failed
|
1.30 (all
atoms)
|
|
Oligomerization domain (1OLG, 4 chains) 100% ID
|
0.57 (all atoms)
|
Failed
|
0.58 (all atoms)
|
|
Oxidoreductase (1NHO, 20 chains) 100% ID
|
0.96 (all atoms)
|
Failed
|
0.96 (all atoms)
|
|

 and
and 